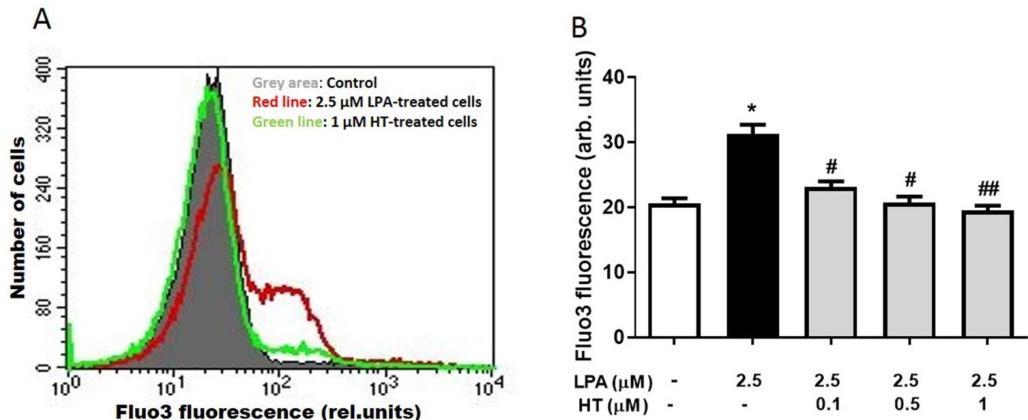
Fig. 3. Effect of HT on intracellular Ca2+ in LPA-treated RBC: Cells were treated with LPA for 24 h in the absence and presence of increasing concentrations of HT. A. Original histogram of the Fluo 3 fluorescence of RBC. B. Arithmetic means ± SEM (n = 8) of RBC. Statistical analysis was performed with one-way ANOVA followed by Tukey's test. * (p<0.05) indicates significant difference from the absence of LPA. # (p <0.05) and ## (p<0.01) indicate significant differences from cells lacking HT treatment.